From the modules to the original application
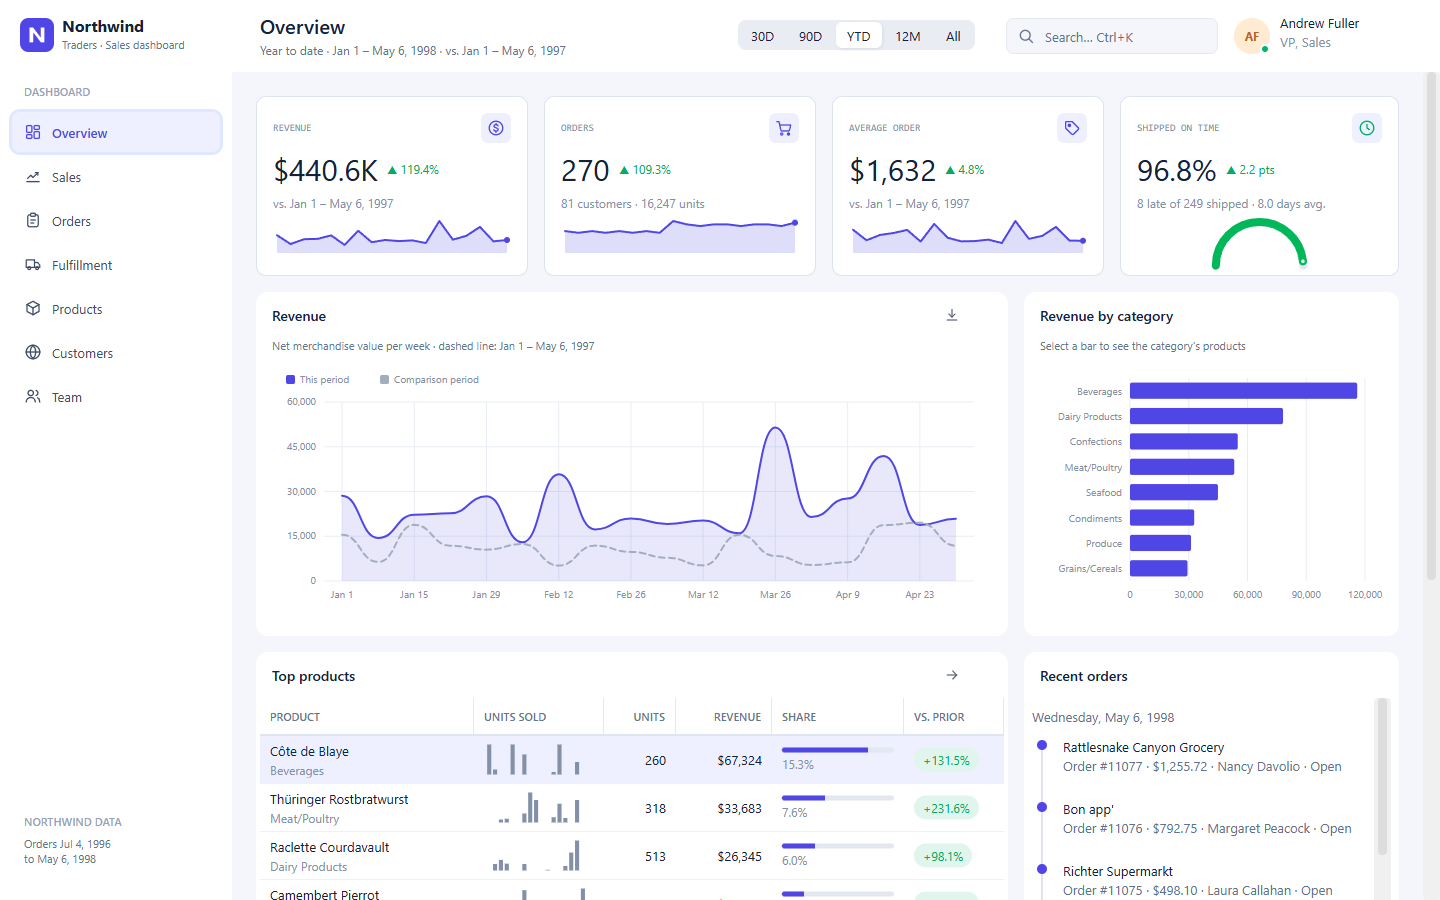
What comes after Module 7. The course folder holds two finished dashboards: Module 7,
the application the seven modules build, and Wisej.NorthwindDashboard,
the original Northwind application the course was built from. This page shows where each piece of
the module applications lives in the original, what differs between the two, and how to run them
side by side. It is the companion of the course's closing section, which has no quiz and no lab.
Run it
The module application, on port 6517:
cd "Northwind Dashboard with AI Course/Module 7/NorthwindDashboard"
dotnet run -f net10.0 --urls http://localhost:6517
The original, on port 6501:
cd "Northwind Dashboard with AI Course/Wisej.NorthwindDashboard"
dotnet run -f net10.0 --urls http://localhost:6501
Open http://localhost:6517 and http://localhost:6501/Default.html in two browser windows. Both
need the .NET 10 SDK and a Wisej.NET development or trial license, and both restore the Wisej.NET
package from Wisej.NorthwindDashboard/packages, as the course README explains.
Two applications, one design
Each module studied one part of the original and rebuilt that part in the module application. The two share more than a design:
- The
Datafolder is the same code in both, file for file. Only the namespace differs. ClientProfiles.jsonis identical.- The views use the same control names and the same event handler names, so a member written in a module can be found in the original by searching for its name.
Module application (Module 7) | Original (Wisej.NorthwindDashboard) | |
|---|---|---|
| Address | http://localhost:6517 | http://localhost:6501/Default.html |
| Namespace | NorthwindDashboard | Wisej.NorthwindDashboard |
| Shell | An application bar, a 150-pixel sidebar and a status strip that names the event path of the last interaction | A sidebar and a header that shows the view title and the period with its date range and comparison; no status strip |
| Choosing a view | The area table in MainPage.Areas.cs, read by Navigate | A switch in MainPage.GetView, called by ShowArea |
| Responsive cards | MainPage.GetView asks CardLayout.For(view) | DashboardView.OnResponsiveProfileChanged creates the CardLayout |
| Theme | Northwind.mixin.theme and four more mixins, one per group of views, in the application blue | One Northwind.mixin.theme, in the indigo palette of the new controls |
Where each module lives in the original
The members in the last column have the same names in the module applications, except ShowArea,
which is Navigate there.
| Module | What it builds | Files in the original | Members to search for |
|---|---|---|---|
| 1 | The shell, the SegmentedButton period selector, the CommandPalette, the first KpiPanel cards, the customer MapView, the session's one DashboardContext | MainPage.cs, SessionStartup.cs, Data/DashboardContext.cs, Views/DashboardView.cs | periodSelector_SelectionChanged, commandPalette_QueryChanged, commandPalette_CommandExecuted, ShowArea |
| 2 | Sparkline trends and the on-time gauge on the cards, the order-stage MeterBar, the shipper RadialGauge controls | Views/OverviewView.cs, Views/FulfillmentView.cs | UpdateKpis, stagesMeter, UpdateShippers |
| 3 | Sales and its ChartView charts; a country bar that opens Customers | Views/SalesView.cs, Views/OverviewView.cs | UpdateCategoryTrend, UpdateBridge, UpdateCountries, UpdateMix, countriesChart_PointClick |
| 4 | Orders: ChipGroup, QueryBuilder, the new grid columns, EmptyState, the order dialog with its Stepper | Views/OrdersView.cs, Views/GridRows.cs, Dialogs/OrderDialog.cs | statusFilter_SelectionChanged, queryBuilder_QueryChanged, ApplyFilters, colActions_ActionClick, OrderDialog.ShowOrder |
| 5 | Fulfillment as KanbanBoard, SchedulerView and GanttView; Products with ActionCardList; Timeline and HeatmapCalendar on Overview | Views/FulfillmentView.cs, Views/ProductsView.cs, Views/OverviewView.cs | kanbanBoard_CardMoving, kanbanBoard_CardMoved, UpdateSchedule, reorderList_CardCreated, ordersHeatmap_CellClick, activityTimeline_ItemClick |
| 6 | The Customers explorer, Team with OrgChart and AvatarGroup, the responsive shell | Views/CustomersView.cs, Views/TeamView.cs, Views/CardLayout.cs, ClientProfiles.json | map_MarkerClick, map_RegionClick, orgChart_NodeClick, customersGroup_ItemClick, OnResponsiveProfileChanged |
| 7 | The category chart on Overview, products and order numbers in the palette, every view checked together | MainPage.cs, Views/OverviewView.cs | categoryChart_PointClick, Search, OrderCommand |
What differs between the two
The original shows more on some views than a walkthrough video has room for, and the module applications have a few pieces the videos needed. Every difference uses a control one of the modules already configures.
| View | Only in the original | Only in the module application |
|---|---|---|
| Overview | revenueChart, the weekly revenue against the comparison period, with a card tool that exports the chart as an image; productsGrid, the top products with subtitle, sparkline, meter and chip columns | The status line that reports a refresh from the shared context |
| Sales | periodGrid, the revenue of each period bucket as a grid with a chip column; a card tool that exports the category chart | revenueChart, the area chart of revenue over time |
| Orders | colSalesRep, an avatar column for the sales representative, and colDelivery, a subtitle column for the delivery | Product, trend and progress columns; the scopeChip and targetChip ChipLabel controls that show what the list is limited to |
| Fulfillment | leadTimeKpi, a KpiPanel with the average days to ship | activityTimeline, the fulfillment activity of the session |
| Customers | A card tool that clears the country filter | countryChip, a closable ChipLabel that shows and clears the country filter |
| Products, Team | Nothing: the same controls and the same handlers | Nothing |
One context in both
What makes seven views one application is the same in both: the session's one DashboardContext.
The file is identical, so each chain runs through the same members.
| Interaction | Chain |
|---|---|
| Period | periodSelector.SelectionChanged → DashboardContext.SetPeriod → PeriodChanged → RefreshView in every view that uses the period |
| Fulfillment | KanbanBoard.CardMoved → DashboardContext.SetStage → OrdersChanged → OnOrdersChanged in every view |
| Purchasing | ActionCard.ActionClick → DashboardContext.PlacePurchaseOrder → ProductsChanged → OnProductsChanged in every view |
| Navigation | DashboardContext.Navigate(area, target) → NavigationRequested → ShowTarget in the view the shell opens |
A visible view refreshes at once. A hidden view is marked stale and refreshes when it is shown
again. That rule is in Views/DashboardView.cs in both applications.
What to try
- Open the same view in both windows. Name each control in the original and the module that builds it, then find its handler with the table above.
- Select 90D in both and compare the four cards on Overview. Both read
SalesAnalyticsthrough their ownDashboardContext. - On Fulfillment, move an open order to Shipped in each application. Then open Overview and Orders and find the change in both.
- Press Ctrl+K in both and search for a customer, a product and an order number.
- Narrow the browser below 1200 pixels and then below 768. Both switch to the Tablet and Phone
profiles of the same
ClientProfiles.json. - Open the original in a private window. It starts from the Northwind snapshot again, as the module application does, because the changes belong to the session.
Using the original as a reference
For a dashboard of your own, start from what the two applications share: an immutable database
shared by all sessions, one context per session, a base view that refreshes on the context's events,
and a shell that only navigates. Then take each control from the module that builds it and read how
the original configures it. The original's own README.md
covers its data rules, theme and responsive layout.