ChartJS
ChartJS puts a Chart.js chart on a Wisej.NET page. You pick a chart type, set the labels, add one or more data sets and adjust the options, all in server code or in the Visual Studio designer. The chart is drawn in the browser on an HTML canvas. Clicking a data point fires a server event, and you can get the rendered chart back as an image.
This extension wraps Chart.js 2.7.2, together with the chartjs-plugin-datalabels plugin and Moment.js 2.29.4 for time scales.
Which ChartJS extension to use
There are three Chart.js extensions. They are separate controls with separate packages and namespaces, and each one wraps a different major version of Chart.js:
| Extension | Package | Namespace | Wraps | Notes |
|---|---|---|---|---|
| ChartJS (this page) | Wisej-4-ChartJS | Wisej.Web.Ext.ChartJS | Chart.js 2.7.2 | The original extension. Title, legend and tooltips are set directly on Options. |
| ChartJS3 | Wisej-4-ChartJS3 | Wisej.Web.Ext.ChartJS3 | Chart.js 3.5.0 | Same object model, reorganized like Chart.js 3: title, legend, tooltip and data labels move under Options.Plugins, and axis limits sit on the axis. |
| ChartJS4 | Wisej-4-ChartJS4 | Wisej.Web.Ext.ChartJS4 | Chart.js 4.5.0 | A rewrite with a new object model (ChartOptions, LineDataSet and so on) that can pass through any Chart.js option. Documented in the API reference and in the 4.1 release notes; this manual does not cover it yet. |
For a new application, prefer the newest one that covers what you need. Keep ChartJS for existing code built on it: moving to ChartJS3 or ChartJS4 changes the class names and the shape of the options, so it's a port rather than a package upgrade.
Installation
Add the package with the NuGet Package Manager, or from the command line:
dotnet add package Wisej-4-ChartJS
The package targets .NET Framework 4.8 and .NET 8 (including the -windows, Android, iOS and Mac Catalyst targets). After a rebuild, ChartJS appears in the Visual Studio toolbox. Chart.js and its plugins are embedded in the assembly, so there is nothing to add to Default.html and no CDN involved.
Getting started
A chart needs three things: a ChartType, the Labels along the category axis, and at least one data set in DataSets.
- C#
- VB.NET
using Wisej.Web.Ext.ChartJS;

private void Page1_Load(object sender, EventArgs e)
{
    this.chartJS1.ChartType = ChartType.Bar;
    this.chartJS1.Labels = new[] { "Jan", "Feb", "Mar", "Apr" };

    var sales = (BarDataSet)this.chartJS1.DataSets.Add("Sales");
    sales.Data = new object[] { 120, 95, 140, 110 };
    sales.BackgroundColor = new[] { Color.SteelBlue };

    this.chartJS1.Options.Title.Display = true;
    this.chartJS1.Options.Title.Text = "Sales by month";
}
Imports Wisej.Web.Ext.ChartJS

Private Sub Page1_Load(sender As Object, e As EventArgs) Handles MyBase.Load
    Me.ChartJS1.ChartType = ChartType.Bar
    Me.ChartJS1.Labels = {"Jan", "Feb", "Mar", "Apr"}

    Dim sales = CType(Me.ChartJS1.DataSets.Add("Sales"), BarDataSet)
    sales.Data = New Object() {120, 95, 140, 110}
    sales.BackgroundColor = {Color.SteelBlue}

    Me.ChartJS1.Options.Title.Display = True
    Me.ChartJS1.Options.Title.Text = "Sales by month"
End Sub
Changing ChartType, Labels, DataSets or Options redraws the whole chart in the browser.
On a category axis, each label corresponds to the value at the same index in every data set. With no labels, a line or bar chart has no categories to plot and shows no points. Set Labels in the designer or in code, with as many entries as the data has values. Scatter and bubble charts are the exception: they place points by their own X and Y values.
Chart types
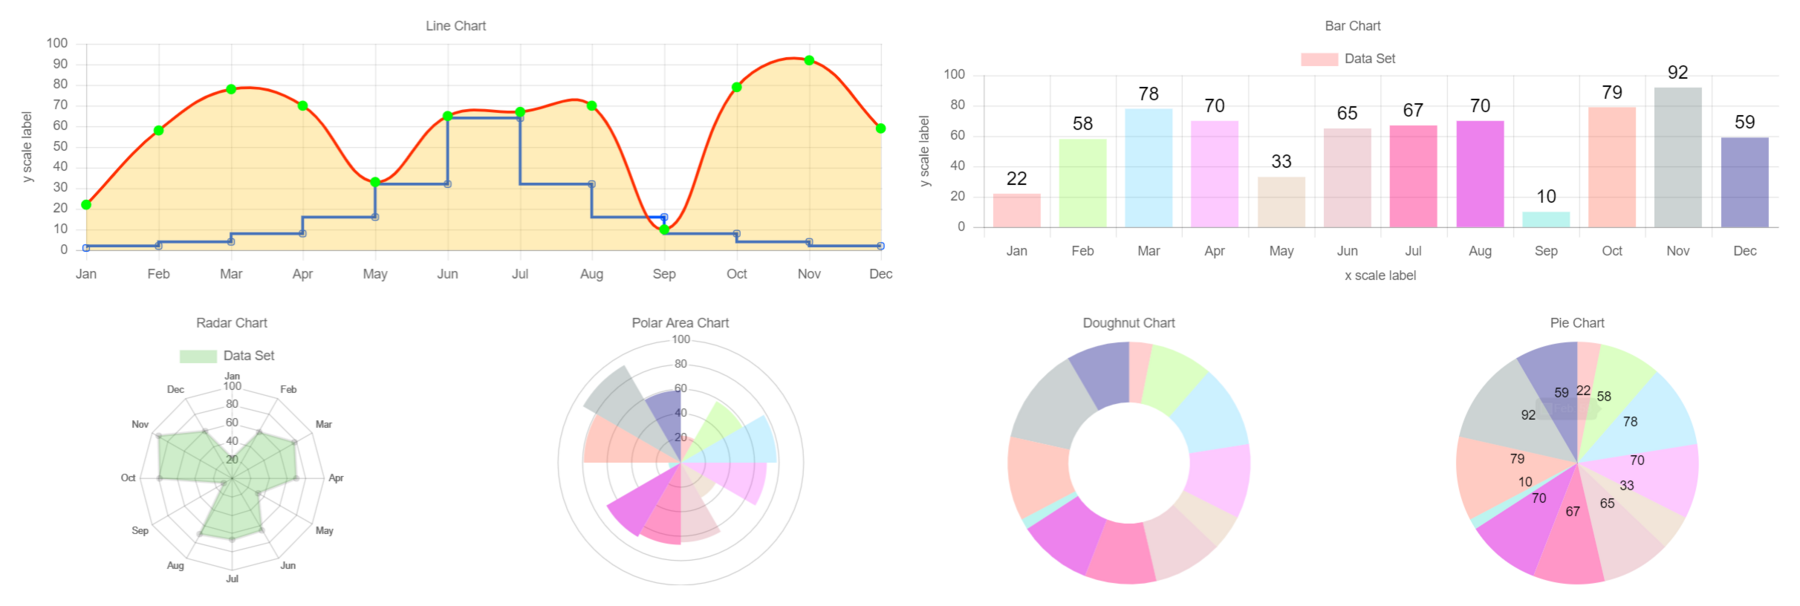
ChartType selects one of nine charts:
| Type | Data | Data set class |
|---|---|---|
Line (default) | One value per label | LineDataSet |
Bar / HorizontalBar | One value per label | BarDataSet / HorizontalBarDataSet |
Radar | One value per label | RadarDataSet |
Pie / Doughnut | One value per slice | PieDataSet / DoughnutDataSet |
PolarArea | One value per segment | PolarAreaDataSet |
Scatter | Points with X and Y | LineDataSet |
Bubble | Points with X, Y and a radius | BubbleDataSet |
Changing the chart type replaces Options with the options class of the new type (for example DoughnutOptions for Doughnut), copying over the options the two share. It also recreates DataSets, so set the type first and then add the data sets.
Data sets
DataSets.Add(name) creates a data set of the class that matches the current chart type and uses the name as its Label, which is shown in the legend and tooltips. Cast the result to reach the type-specific properties. The collection can also be indexed by label, as in DataSets["Sales"].
All data sets share these properties from DataSet:
| Property | Default | What it does |
|---|---|---|
Data | null | The values to plot: numbers, or points for scatter and bubble charts. |
Label | "" | The name shown in the legend and tooltips. |
BackgroundColor / BorderColor / BorderWidth | empty / empty / 0 | Fill and border. Bar, pie, doughnut and polar area data sets take an array, with one color per bar or slice. A single entry applies to all of them. |
Formatted | null | Text to show instead of the raw values when data labels are displayed. |
Hidden | false | Hides the data set, which the user can bring back from the legend. |
Order | 0 | Drawing order. It also affects stacking, tooltips and the legend. |
xAxisID / yAxisID | null | Binds the data set to an axis by its Id, for charts with more than one axis. |
Line data sets add Fill, LineTension (0 draws straight lines), SteppedLine, BorderDash, ShowLine and SpanGaps. The point properties (PointRadius, PointStyle, PointBackgroundColor and so on) are arrays too: one entry styles every point, or you give one entry per point.
Plotting X/Y points
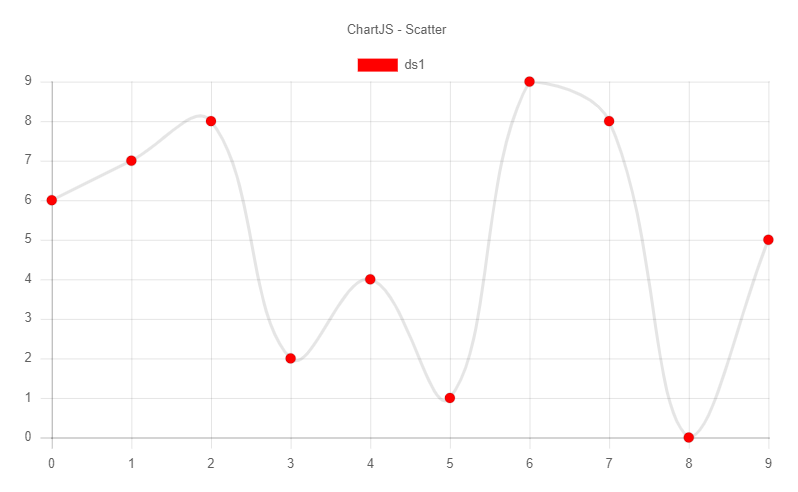
Scatter charts, and line charts on a linear X axis, take points instead of plain values:
- C#
- VB.NET
this.chartJS1.ChartType = ChartType.Scatter;

var random = new Random();
var data = new object[10];
for (int i = 0; i < data.Length; i++)
    data[i] = new Point(i, random.Next(10));

var ds = (LineDataSet)this.chartJS1.DataSets.Add("ds1");
ds.Data = data;
ds.PointBackgroundColor = new[] { Color.Red };
Me.ChartJS1.ChartType = ChartType.Scatter

Dim random As New Random()
Dim data(9) As Object
For i As Integer = 0 To data.Length - 1
    data(i) = New Point(i, random.Next(10))
Next

Dim ds = CType(Me.ChartJS1.DataSets.Add("ds1"), LineDataSet)
ds.Data = data
ds.PointBackgroundColor = {Color.Red}
Options
Options is created automatically for the current chart type. The server sends it to Chart.js as its options object, with camel-case names and without the values left at null. The sets that every chart type shares are:
| Option set | Class | Typical use |
|---|---|---|
Options.Title | OptionsTitle | Display, Text, Position, Font, FontColor |
Options.Legend | OptionsLegend | Display, Position, Labels |
Options.Tooltips | OptionsTooltips | Enabled |
Options.Scales | OptionsScales | The xAxes and yAxes arrays |
Options.DataLabel | OptionsDataLabel | Values drawn on the chart by the data-labels plugin |
Type-specific classes add to these: for example Stacked on BarOptions and LineOptions, and CutoutPercentage on DoughnutOptions. Cast Options to the type-specific class to reach them:
- C#
- VB.NET
// Hide the tooltips and the legend.
this.chartJS1.Options.Tooltips.Enabled = false;
this.chartJS1.Options.Legend.Display = false;

// A doughnut with a larger hole.
this.chartJS1.ChartType = ChartType.Doughnut;
((DoughnutOptions)this.chartJS1.Options).CutoutPercentage = 60;
' Hide the tooltips and the legend.
Me.ChartJS1.Options.Tooltips.Enabled = False
Me.ChartJS1.Options.Legend.Display = False

' A doughnut with a larger hole.
Me.ChartJS1.ChartType = ChartType.Doughnut
CType(Me.ChartJS1.Options, DoughnutOptions).CutoutPercentage = 60
An Options instance belongs to one chart. Assigning an instance that's already attached to another ChartJS control throws an InvalidOperationException.
Axes
The axes are arrays: Options.Scales.xAxes holds OptionScalesAxesX entries and Options.Scales.yAxes holds OptionScalesAxesY entries. Each axis has a Type (Category, Linear, Logarithmic, Time, RadialLinear), a ScaleLabel (the axis title), GridLines, Stacked, an Id that data sets refer to, and Ticks. In Chart.js 2 the limits of an axis are on its ticks:
- C#
- VB.NET
this.chartJS1.Options.Scales.yAxes = new[]
{
    new OptionScalesAxesY
    {
        Ticks = new OptionsScalesTicks { Min = 0, Max = 100, StepSize = 20 }
    }
};
Me.ChartJS1.Options.Scales.yAxes = {
    New OptionScalesAxesY With {
        .Ticks = New OptionsScalesTicks With {.Min = 0, .Max = 100, .StepSize = 20}
    }
}
OptionsScalesTicks also has BeginAtZero (default true), Reverse, AutoSkip, MinRotation/MaxRotation, Font and FontColor. For dates on the X axis, set the axis Type to Time and configure its ScaleTime: Unit, Parser, TooltipFormat and DisplayFormats. These use Moment.js format strings.
Data labels
Options.DataLabel controls the values drawn on the chart itself, like the numbers on the bar and pie charts at the top of this page. Labels are off by default. Turn them on with Display, and position them with Anchor, Align and Offset. To show text other than the raw value, such as a currency or a percentage, fill the data set's Formatted array:
- C#
- VB.NET
var labels = this.chartJS1.Options.DataLabel;
labels.Display = true;
labels.Anchor = DataLabelAnchor.End;
labels.Align = DataLabelAlign.Top;

var sales = this.chartJS1.DataSets["Sales"];
sales.Formatted = sales.Data.Select(v => string.Format("{0:C0}", v)).ToArray();
Dim labels = Me.ChartJS1.Options.DataLabel
labels.Display = True
labels.Anchor = DataLabelAnchor.End
labels.Align = DataLabelAlign.Top

Dim sales = Me.ChartJS1.DataSets("Sales")
sales.Formatted = sales.Data.Select(Function(v) String.Format("{0:C0}", v)).ToArray()
Updating data
Assigning new data sets or labels redraws the chart from scratch. For live data, change the values in place and call UpdateData instead. It sends only the Data and Formatted values and the Labels, and Chart.js animates from the old values to the new ones (300 ms by default).
- C#
- VB.NET
private void timer1_Tick(object sender, EventArgs e)
{
    var random = new Random();
    var data = this.chartJS1.DataSets[0].Data;
    for (int i = 0; i < data.Length; i++)
        data[i] = random.Next(100);

    this.chartJS1.UpdateData(500);
}
Private Sub Timer1_Tick(sender As Object, e As EventArgs) Handles Timer1.Tick
    Dim random As New Random()
    Dim data = Me.ChartJS1.DataSets(0).Data
    For i As Integer = 0 To data.Length - 1
        data(i) = random.Next(100)
    Next

    Me.ChartJS1.UpdateData(500)
End Sub
UpdateData expects the same data sets in the same order as the last full render. If you add or remove a data set, or change anything other than the values and the labels, let the chart redraw instead.
Getting the chart as an image
GetImageAsync asks the browser for a PNG of the canvas and returns it as a System.Drawing.Image, for a report, a PDF or an e-mail. GetImage does the same with a callback. The chart is drawn over the control's BackColor. The result is null if the chart hasn't been rendered yet.
- C#
- VB.NET
private async void buttonSnapshot_Click(object sender, EventArgs e)
{
    var image = await this.chartJS1.GetImageAsync();
    if (image != null)
        this.pictureBox1.Image = image;
}
Private Async Sub ButtonSnapshot_Click(sender As Object, e As EventArgs) Handles ButtonSnapshot.Click
    Dim image = Await Me.ChartJS1.GetImageAsync()
    If image IsNot Nothing Then Me.PictureBox1.Image = image
End Sub
Events
| Event | When |
|---|---|
ChartClick | The user clicks one or more chart elements. It doesn't fire for clicks on an empty area, or at design time. |
ChartClickEventArgs has SelectedDataSet and SelectedValue for the element directly under the pointer, plus DataSets, DataPoints (indexes) and Values for every element within the click radius:
- C#
- VB.NET
private void chartJS1_ChartClick(object sender, ChartClickEventArgs e)
{
    AlertBox.Show($"{e.SelectedDataSet.Label}: {e.SelectedValue}");
}
Private Sub ChartJS1_ChartClick(sender As Object, e As ChartClickEventArgs) Handles ChartJS1.ChartClick
    AlertBox.Show($"{e.SelectedDataSet.Label}: {e.SelectedValue}")
End Sub
Designer support
At design time the chart shows a preview. While no data set has data, the designer draws a sample data set with random values, one for each label, so you can work on the type, colors and options before any real data is bound. Set Labels, ChartType and the options in the property grid. Fill the data at runtime.
Extending on the client
ChartJS is a Widget. The Chart.js instance is available in the browser as this.chart inside the widget. To add client-side behavior, derive from ChartJS and extend InitScript:
public class MyChart : ChartJS
{
    public override string InitScript
    {
        get { return base.InitScript + "\r\nthis.refresh = function() { this.chart.update(); };"; }
        set { }
    }
}
Server code can then run it with Call("refresh"). See JavaScript for how widgets and server code talk to each other.
API reference
ChartJSChartTypeDataSetandDataSetCollectionOptionsandOptionsScalesChartClickEventArgs- The whole
Wisej.Web.Ext.ChartJSnamespace