Android
Below is a guide from the .NET Android Documentation:
Using a device connected via USB
Startup profiling
Set up reverse port forwarding:
Note that you can skip this step if the Android application is running on an Android emulator; it is only required for physical Android devices.
This will forward port 9000 on device to port 9001.
Alternatively:
This will allocate a random port on remote and forward it to port 9001 on the host. The forwarded port is printed by adb
Configure the device so that the profiled app suspends until tracing utility connects
Install dotnet-dsrouter
dotnet-dsrouterGenerally, you can use a stable dotnet-dsrouter from NuGet:
Or use a build from the nightly feed https://aka.ms/dotnet-tools/index.json:
Start the tracing router/proxy on host
For profiling an Android application running on an Android emulator:
For Android devices
For profiling an Android application running on an Android device:
Eventually, we will be able to simply do dotnet-dsrouter android when dotnet/diagnostics#4337 is resolved. adb reverse tcp:9000 tcp:9001 is also currently required as mentioned above.
Start the tracing client
First, run dotnet-trace ps to find a list of processes:
dotnet-trace knows how to tell if a process ID is dotnet-dsrouter and connect through it appropriately.
Using the process ID from the previous step, run dotnet-trace collect:
The --format argument is optional and it defaults to nettrace. However, nettrace files can be viewed only with Perfview on Windows, while the speedscope JSON files can be viewed "on" Unix by uploading them to https://speedscope.app
Compile and run the application
NOTE: -f net8.0-android is only needed for projects with multiple $(TargetFrameworks).
Once the application is installed and started, dotnet-trace should show something similar to:
Once <Enter> is pressed, you should see:
And the output files should be found in the current directory. You can use the -o switch if you would prefer to output them to a specific directory.
How to get GC memory dumps?
If running on desktop, you can use the dotnet-gcdump global tool. This can be installed via:
To use it, for example:
See the dotnet-gcdump documentation for further details about its usage.
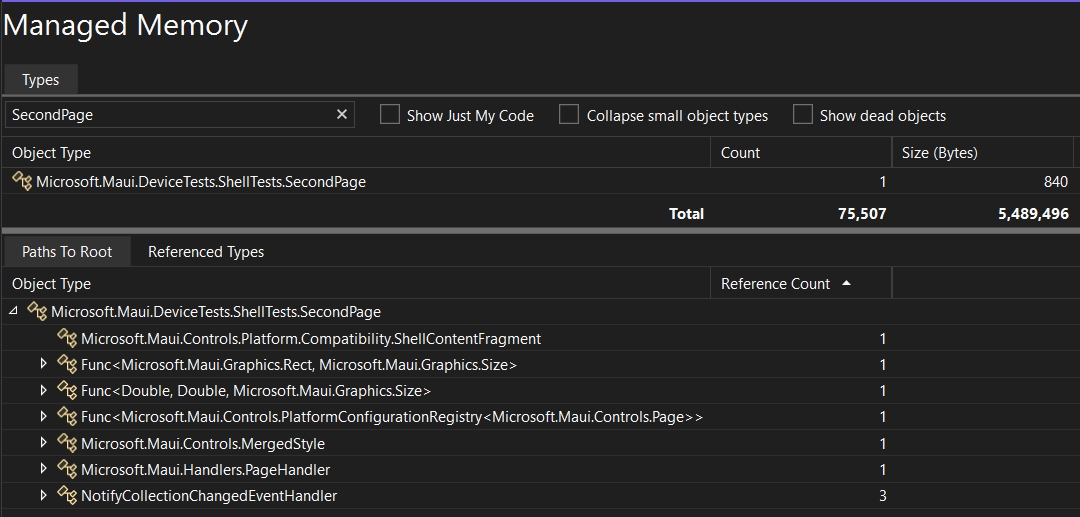
This will connect to a process and save a *.gcdump file. You can open this file in Visual Studio on Windows, for example:

Memory Dumps for Android in .NET 8+
In .NET 8, we have a simplified method for collecing *.gcdump files for Android applications. To get this data from an Android application, you need all the above setup for adb shell, dsrouter, etc. except you need to simply use dotnet-gcdump instead of dotnet-trace:
This will create a *.gcdump file in the current directory.
Memory Dumps for Android in .NET 7
In .NET 7, we have to use th older, more complicated method for collecting *.gcdump files for Android applications. To get this data from an Android application, you need all the above setup for adb shell, dsrouter, etc.
0xC900001, a bitmask, enables the following event types:
GCKeywordGCHeapCollectKeywordGCRootKeyword
See the Microsoft-DotNETRuntimeMonoProfiler event types for more info.
:4 enables "Informational" verbosity, where the different logging levels are described by dotnet-trace help output.
This saves a .nettrace file with GC events that are not available with the default provider.
To actually view this data, you'll have to use one of:
Using mono-gcdump:
This saves a foo.gcdump that you can open in Visual Studio.
See the dotnet/runtime documentation for additional details.
How to dotnet trace our build?
dotnet trace our build?Setting this up is easy, the main issue is there end up being potentially a lot of threads (30-40) depending on the build.
Before getting started, I would recommend doing these things to make the trace smaller and easier to understand:
Set
$DOTNET_CLI_TELEMETRY_OPTOUTto1, to avoid any dotnet CLI telemetry in the trace.Profile a single
.csprojbuild, not a.sln. This keeps the build in-process.Always
restorein a separate step and use--no-restorewhen you trace. This avoids NuGet logic in the trace.Save a
.binlog, so you can review that the build actually did what you expected.dotnet tracetends to hide all the console output.
So, for example, to profile a build:
This should result in .speedscope and .nettrace files in the current directory.
If you wanted to profile deploy & app launch, do a build first:
I found that " is necessary when : characters are present in the command. This appears to be some kind of argument parsing issue with dotnet trace.
Last updated
