Windows
Below is a guide for profiling a Windows .NET MAUI application from:
Windows & PerfView
PerfView is probably the simplest way to profile a .NET MAUI application running on Windows. We recommend using a Release build with ReadyToRun enabled. See our Windows Publishing Documentation for details about building a Release version of your app.
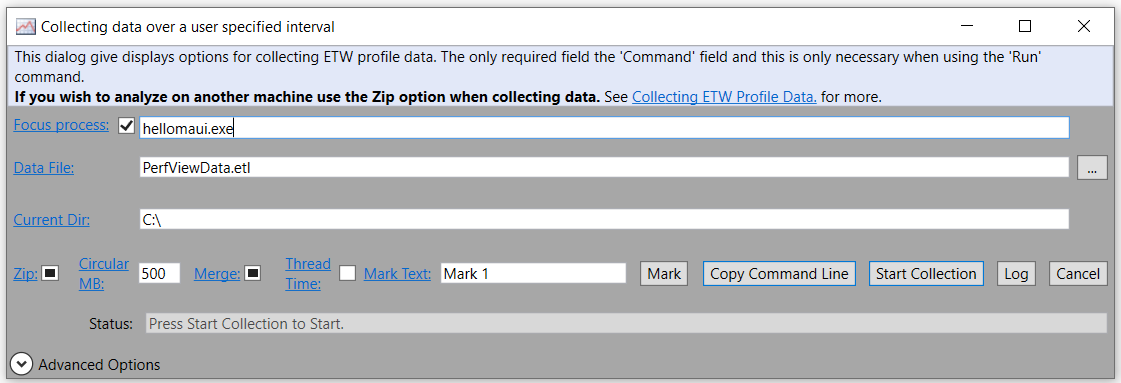
Begin by selecting the Collect > Collect menu. For a project named hellomaui, you can filter on hellomaui.exe:

Click Start Collection and manually launch your app.
Click Stop Collection when your app has launched and reached the point you are finished profiling.
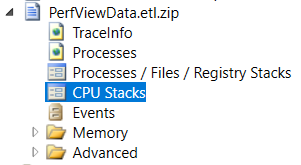
Open CPU Stacks to view timing information of methods inside your app:

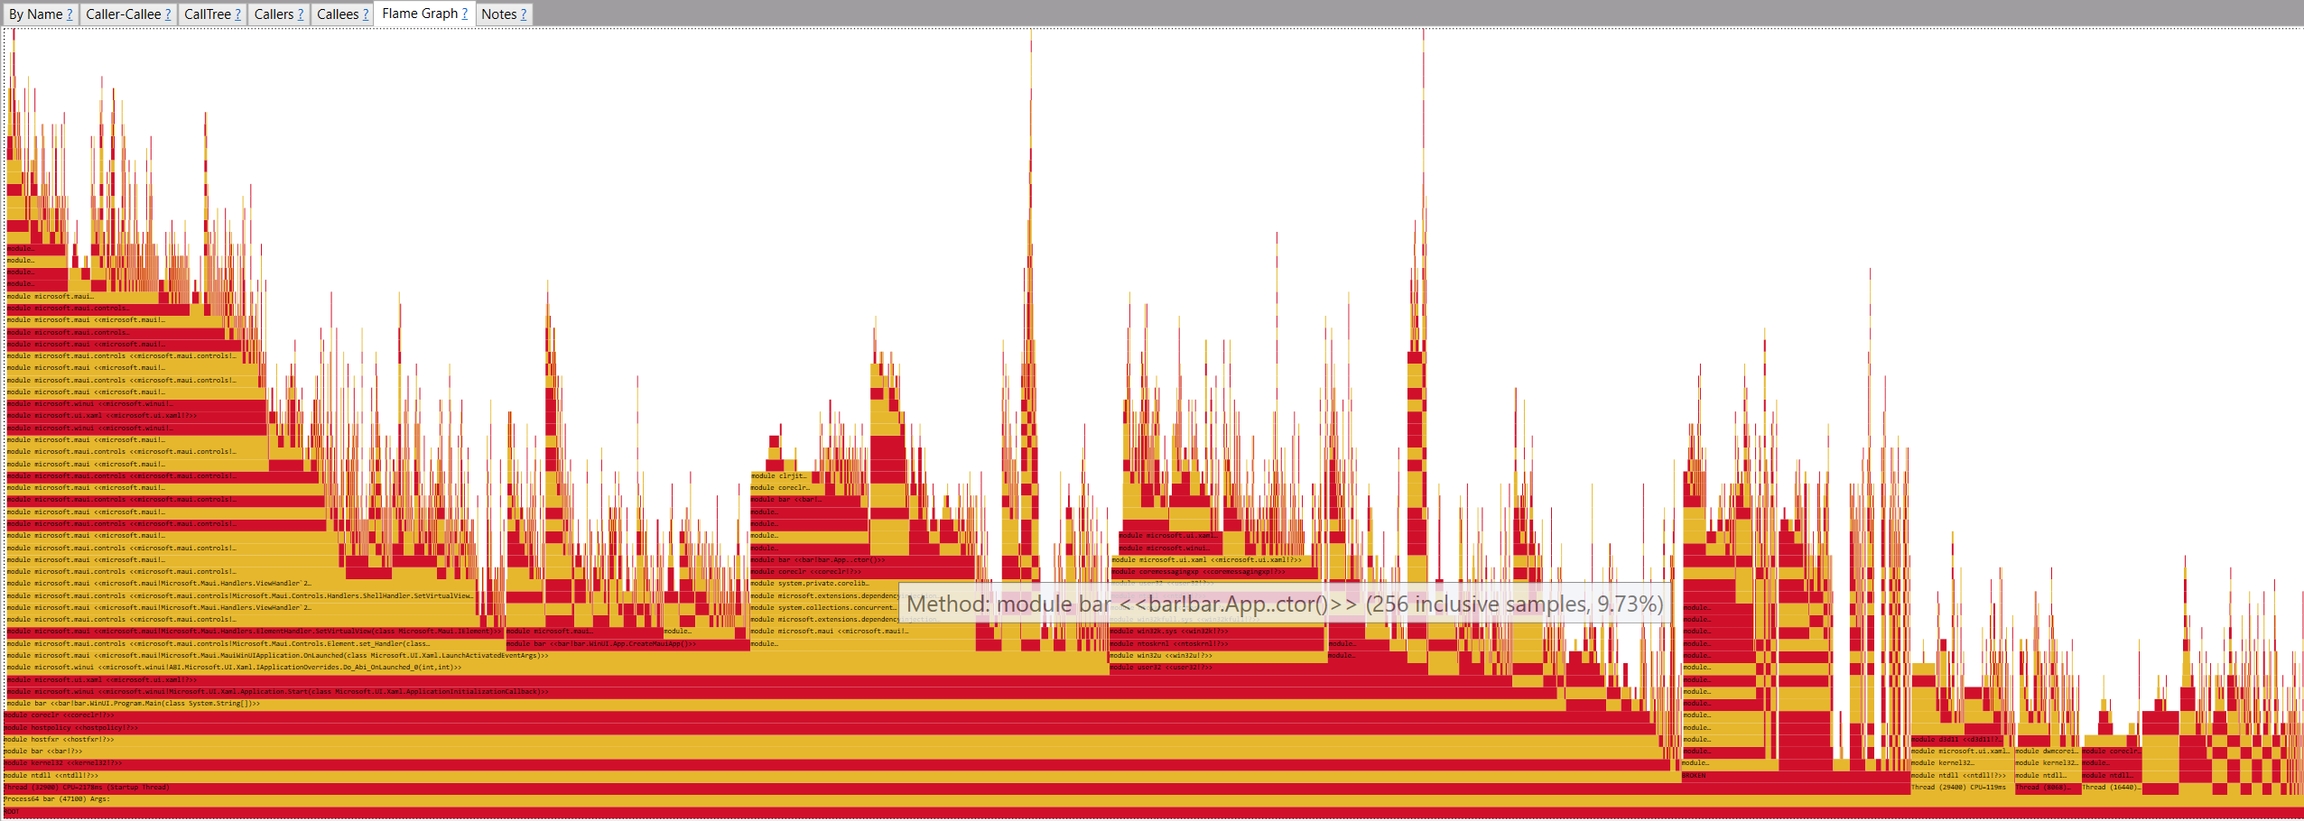
Use the Flame Graph tab for a graphical view:

You can also do File > Save View As to save the file in SpeedScope format. This allows you to open the file in https://speedscope.app/ as we recommend for iOS/Android projects.
Windows & dotnet-trace
dotnet-traceYou can get a .nettrace or .speedscope file by publishing your app "unpackaged":
Then run dotnet-trace against the published .exe:
This will place a .nettrace file in the current directory. You can also use --format speedscope to open the file in https://speedscope.app/.
Last updated